
The Wisconsin Institute of Discovery presents a unique exhibit that merges the realms of art and data science, showcasing the intrinsic connection between creativity and analytics. This engaging display invites visitors to explore how data can be beautifully translated into visual representations, breaking down the perceived barriers between science and art.
Art Transcending Data: Faces of Dimensionality
Embark on a journey into the realm of computational art, where human faces are transformed into stunning visual representations of statistical complexity.
The exhibit unveils the captivating artwork titled 'Faces of Dimensionality: The Eigenfaces,' which pushes the boundaries of computational art. Expanding beyond the physical realm, this display delves into the statistical world, where complexities of human faces are elegantly translated into visually mesmerizing artwork.
Through the use of data, viewers are prompted to reconsider the way we perceive and interpret the intricacies of dimensionality. Scientific and artistic worlds intertwine in this captivating display that challenges our notion of aesthetics and transcends the boundaries of data representation to craft a truly unique experience.
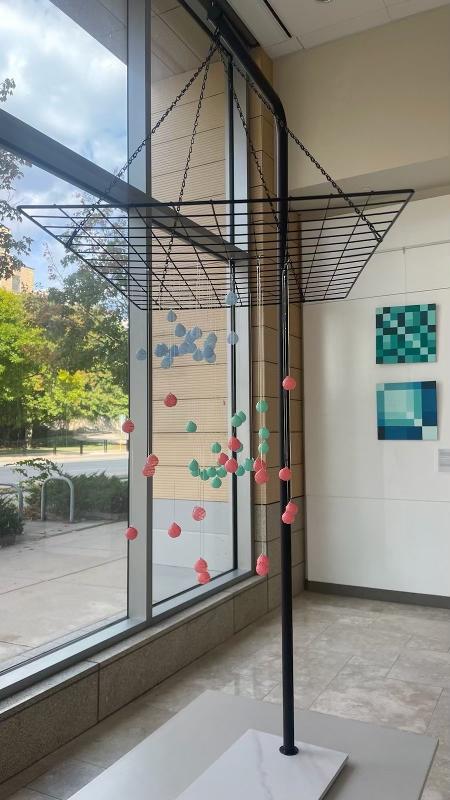
Perception and Perspective: Bridging Biologial and Data Science Realms
Explore the significance of perspective in interpreting dimensional data by drawing connections between the dynamic world of Iris flowers and the wonders of data science.
In this section, visitors are presented with a curious juxtaposition of the biological world and the realm of data science. By linking the radiant beauty of Iris flowers to complex dimensional data, this display challenges the viewers' brain to decipher and interpret the intertwined dimensions.
Uncover the role of perspective in understanding data, as the dazzling array of petal colors takes visitors on a visual journey to explore the vibrancy and interconnectedness of life and analytics. The exhibition beautifully illustrates how diverse perspectives are fundamental in data science, fostering deeper insights through multi-dimensional lens.
Visualization Unleashed: Decoding the Power of Color Maps
Experience the ubiquitous influence of visualization in decoding and inferring key insights from complex data.
Delve into the enthralling visual world of color maps and uncover the inherent wonders that lie within these vibrant gradients. This mesmerizing display delves into the power of human perception, as color maps are artfully employed to illuminate personal nature and enable data understanding.
By harnessing the synergy of artistic expression and scientific data, this exhibition showcases the instrumental role of visualization for deciphering complex concepts. Awaken your senses as you navigate the vivid landscapes of colors and uncover hidden patterns that lay within the realm of data.
Exploring the Grassmannian Manifold: An Artistic Two-Dimensional Existence
Unravel the enigmatic facets of the Grassmannian manifold, where the essence of a two-dimensional existence intersects art and mathematics.
In this section, spectators are transported into the captivating world of the Grassmannian Manifold—an abstract realm that captivates the intersection of art and mathematics. Explore the intricacies and simplicity encapsulated within a two-dimensional existence, as depicted through captivating visual representations.
Discover the harmony between artistry and mathematical principles, as the Grassmannian Manifold teaches the viewer about spatial dimensions and offers a glimpse into the realm that unites the disciplines of art and data science. Immerse yourself in the evocative imagery, stimulating both the aesthetic senses and your perception of the surrounding data-inspired world.
Fostering Creative Bursts: Unified Excellence of Art and Data Science
Unveil the powerful convergence of skills in creative and scientific spheres, defying perceived boundaries for professionals in the field.
This final section highlights the interconnected nature of data science—a realm that thrives on both creative skills and scientific knowledge. Far from mere rationality, data scientists flourish amidst ambition and inherent curiosity, engaging with ambiguity, and exploring the depths of uncertainty.
This synergy of scientific prowess and artistic flair challenges conventional perceptions of professions and industries, revealing the untapped and often misunderstood strengths of professionals that integrate creativity and analytical thinking. Envisioning novel solutions and illuminating groundbreaking patterns, data scientists and artists forge uncharted paths in the domain of innovation and interdisciplinary collaboration.
Conclusion
The intersection of art and data science showcased in this captivating exhibition at the Wisconsin Institute of Discovery demonstrates the powerful connection between analytical thinking and creative expression. Through visually stunning displays and thought-provoking representations, the exhibit redefines the boundaries often associated with these fields.
By embracing the fusion of artistry and analytics, visitors are invited to perceive data in a whole new light, unveiling novel approaches to understanding complexity and unlocking hidden patterns. This unique collaboration highlights the rich potential that exists in the overlap of different disciplines, paving the way for groundbreaking innovations and holistic insights.
FQA :
What is the significance of integrating art and data science?
The integration of art and data science offers a fresh perspective on analyzing and presenting complex data. Not only does it enhance the aesthetic appeal of data representation, but it also encourages innovative thinking and fosters a deeper understanding of patterns and insights.
Why is visualization important in data analysis?
Visualization plays a vital role in data analysis as it allows us to observe and comprehend vast amounts of information in a more intuitive and accessible manner. By transforming data into visual representations like color maps and interactive displays, it enables us to uncover patterns, trends, and relationships that could otherwise go unnoticed.
How does the exhibition challenge traditional perceptions of data scientists and artists?
The exhibition challenges the conventional perception of data scientists merely being purely rational and artists being confined to their own artistic world. By showcasing the creative and interdisciplinary aspects of data science, it celebrates the ability of these professionals to integrate analytical thinking with artistry, resulting in innovative and holistic approaches to problem-solving.
What can visitors gain from exploring the Grassmannian Manifold display?
The Grassmannian Manifold display offers a captivating exploration of the intersecting realms of art and mathematics within a two-dimensional existence. It not only provides viewers with a deeper understanding of spatial dimensions but also highlights the harmonious relationship between artistic expression and mathematical principles in sparking creativity and insights.
